Hello! In this article, I will explain how I turned a cloud server (located physically in Frankfurt and equipped with 2 CPUs, 4 GB of RAM, and 40 GB of disk space) into a honeypot, and then installed Wazuh to analyze the incoming attacks. If you want to go directly to Log Analysis and Threat Intelligence, you can click here.
HONEYPOT AND WAZUH INSTALLATION
First, let’s log in using the root credentials provided by the cloud server, and then set a strong root password.
Now, let’s create a new user account that we will use ourselves.
Before switching to our new user, let’s update the necessary packages on the server.

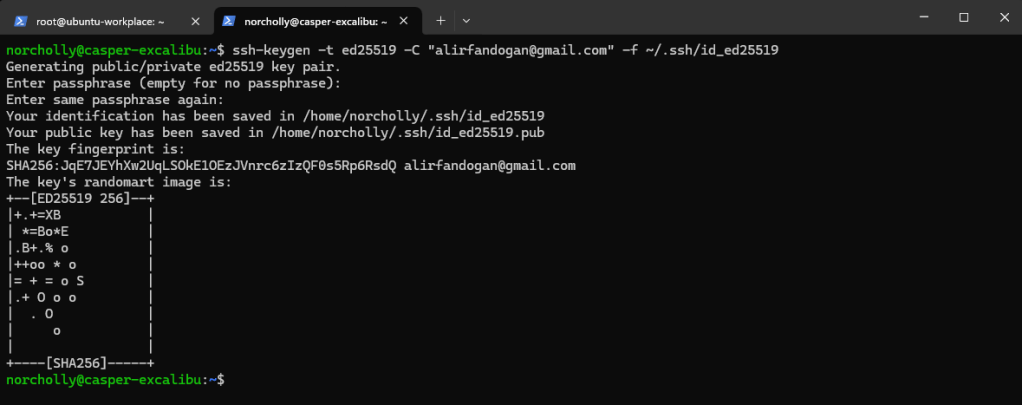
Without closing the root terminal, open a new terminal on your own computer (not on the cloud server) and generate an SSH key.
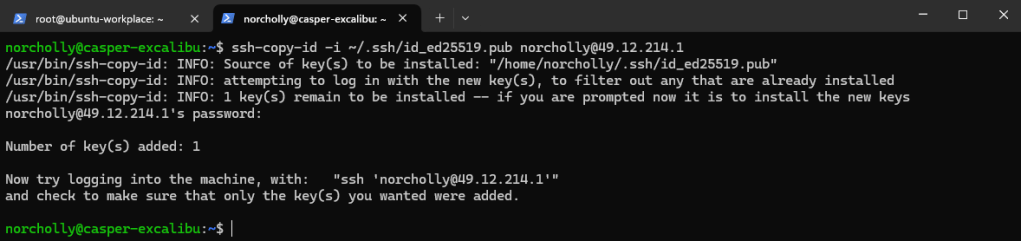
Then, let’s set up SSH key-based authentication by copying this key to the user we will use on the cloud server.
Now, let’s try logging in using the key, without any password.
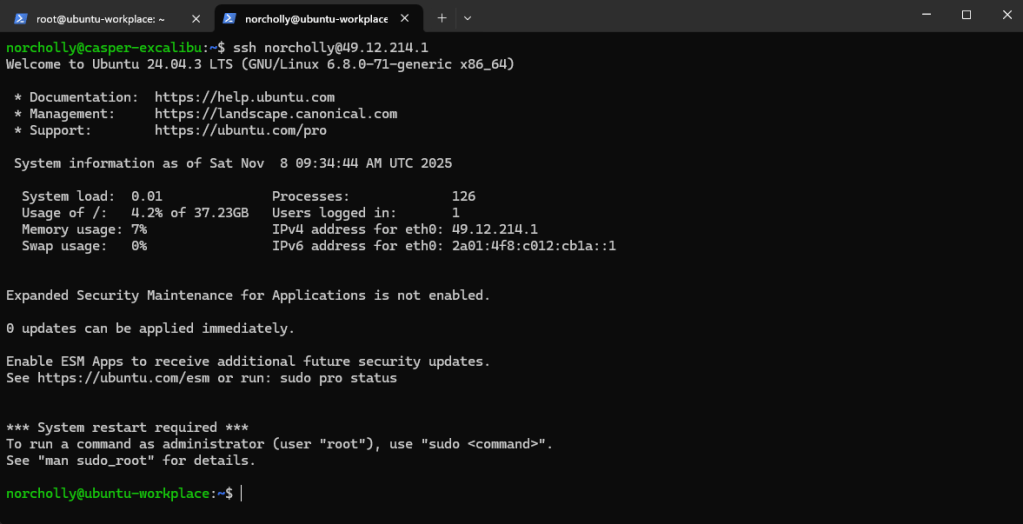
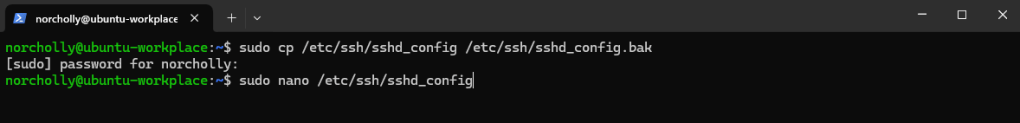
Our login was successful. Next, we need to configure SSH settings. But first, it’s important to make a backup in case something goes wrong. After backing up, let’s open the configuration file.
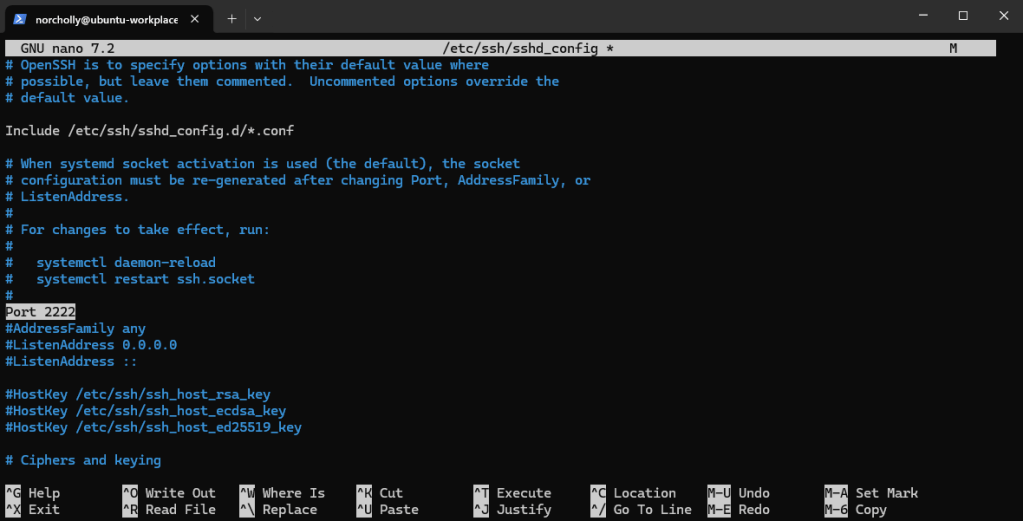
Since our honeypot will listen on port 22 (the current SSH port), let’s move the real SSH service to port 2222.
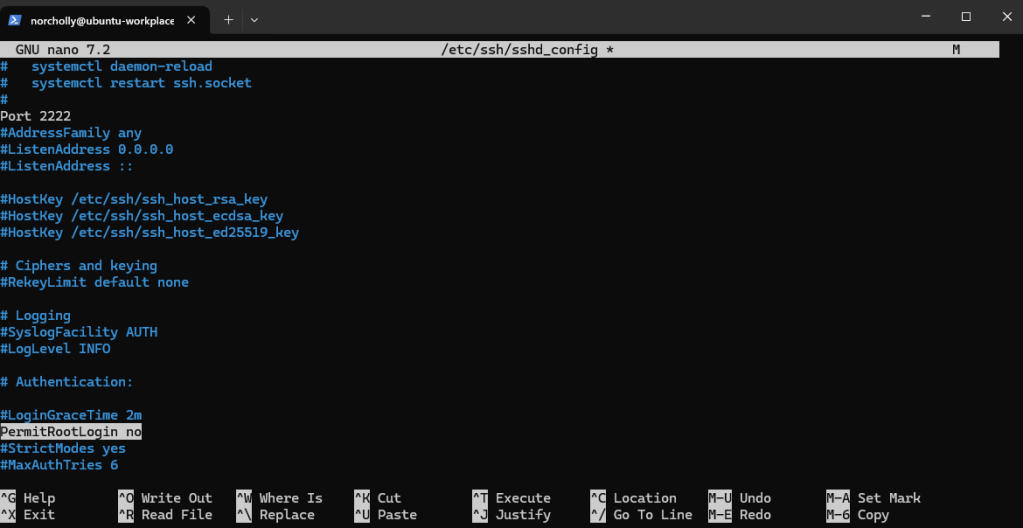
Let’s disable SSH logins for the root user.
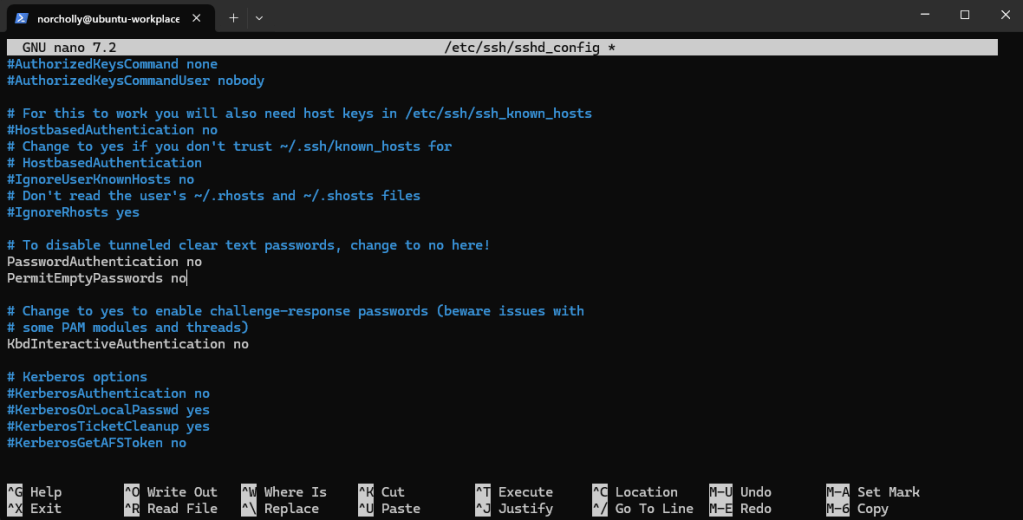
Let’s completely disable password authentication on the server. From now on, only users with an SSH key (like the one we set up earlier) will be able to log in.
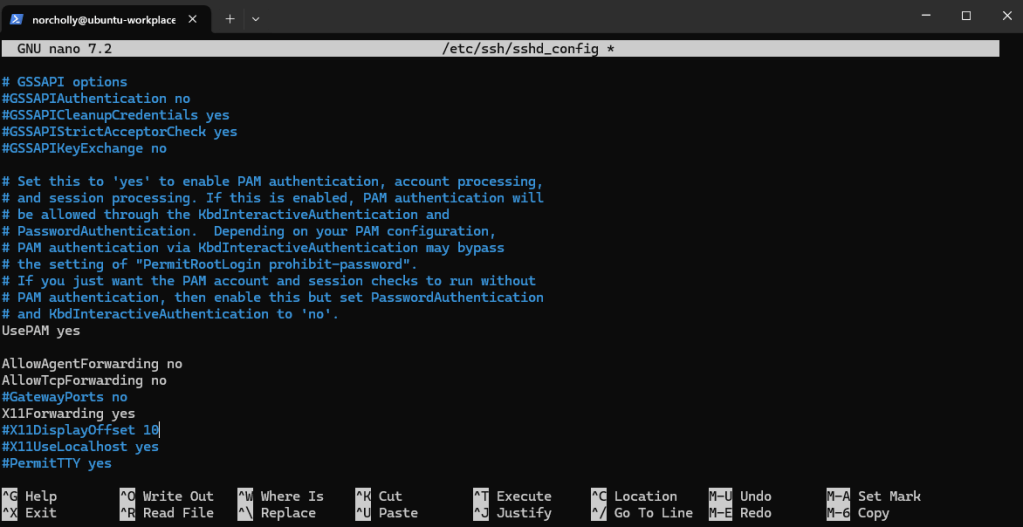
Let’s allow SSH to use Linux’s Pluggable Authentication Modules (PAM) for authentication.
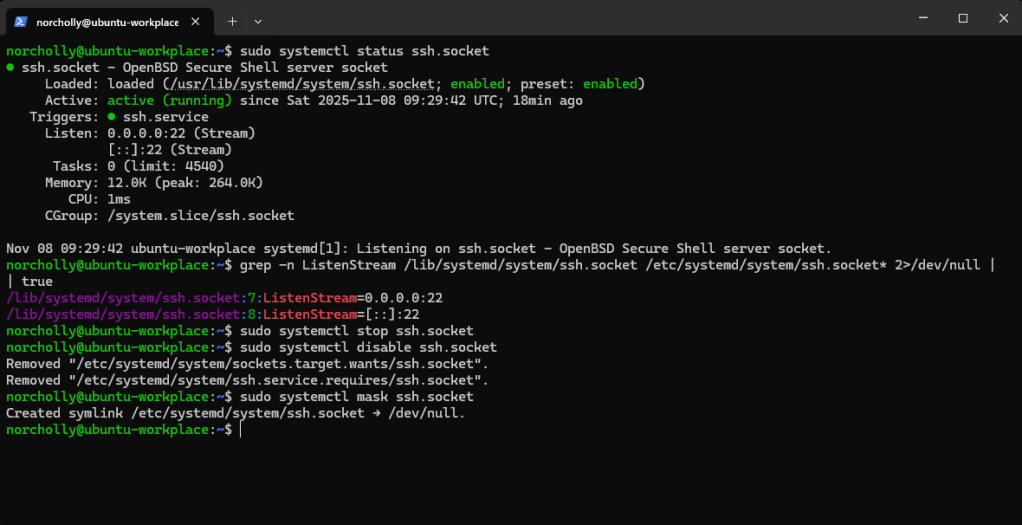
When we check which ports ssh.socket is listening on, if we still see 22—meaning our changes haven’t taken effect yet—we need to mask and disable the ssh.socket.
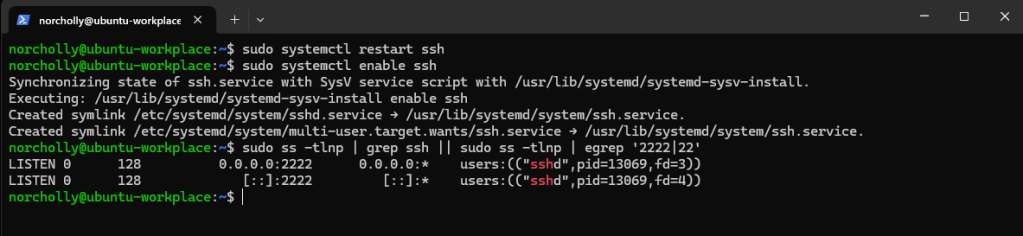
Now, when we restart the SSH service and check which ports it is listening on, we can see that our settings have been applied successfully.
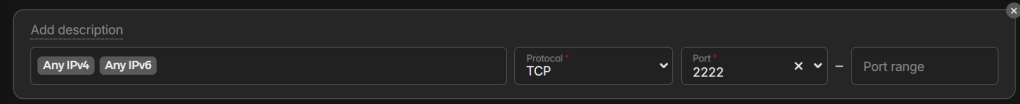
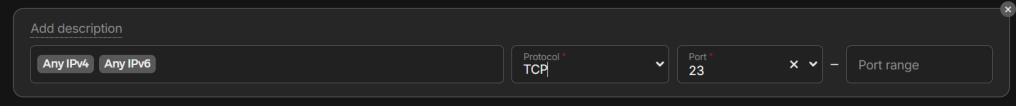
IMPORTANT!: Depending on the cloud service you use, you may need to configure the firewall.
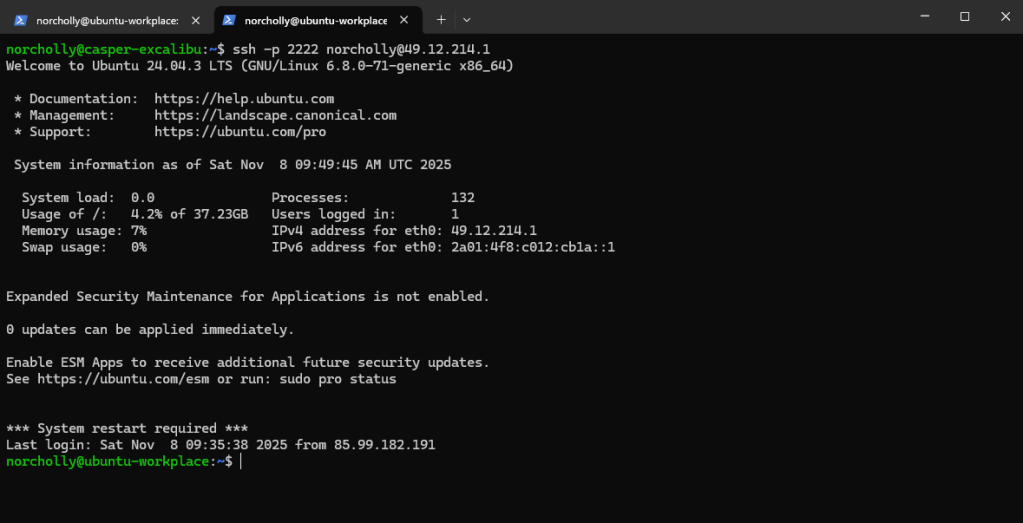
Now, let’s try logging in using port 2222.
Now that we have secured the server, let’s install Wazuh, an open-source SIEM tool, to monitor logs and alerts from our honeypot.
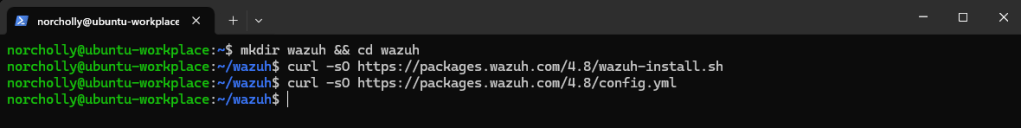
Let’s run the wazuh-install.sh file that we downloaded.

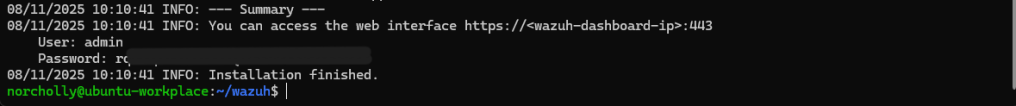
After the installation is complete, it will give us a username and password to access the web interface.
IMPORTANT!: Depending on the cloud service you use, you may need to configure the firewall.

We open the Wazuh interface by entering our IP address and port in a browser. After entering the provided username and password, the main dashboard appears.
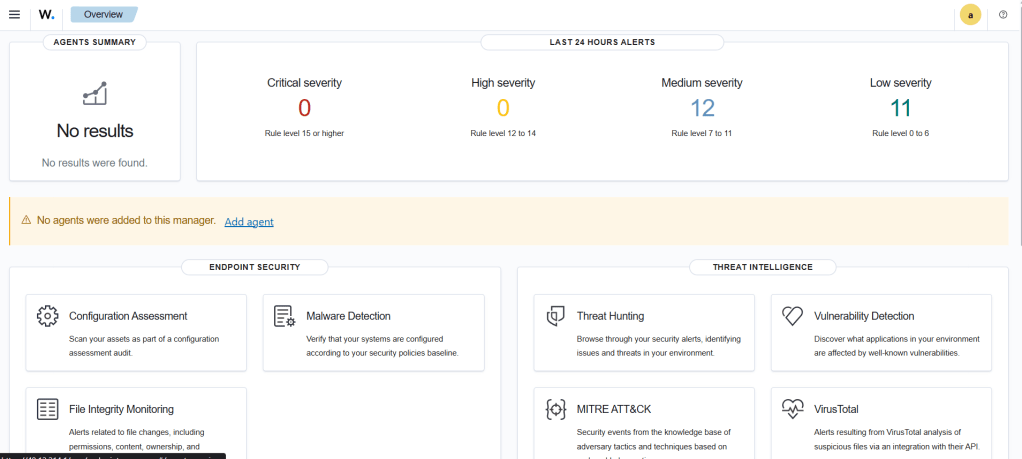
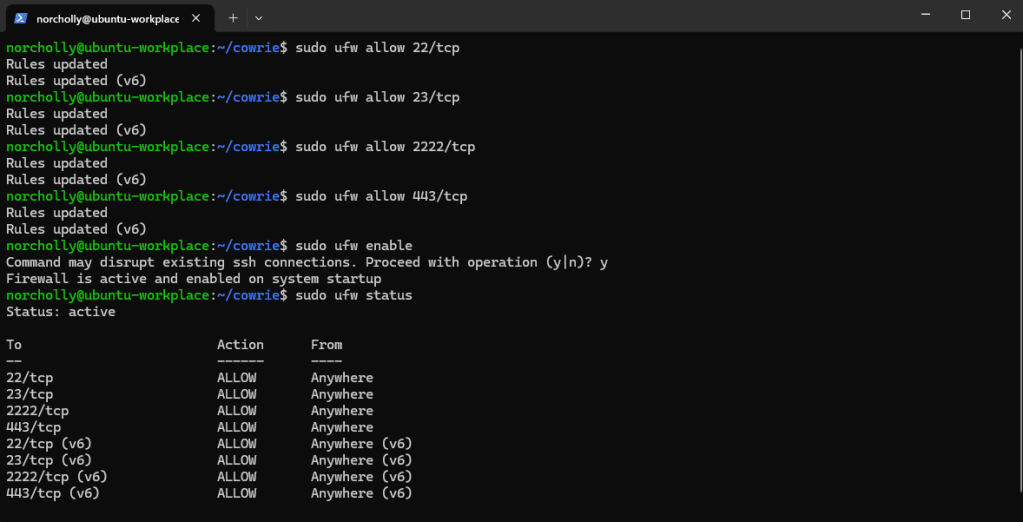
We don’t need to install a Wazuh agent right now because Wazuh is already installed on the device we will use as a honeypot. Also, the low-level alerts you see now come from the system, meaning Ubuntu logs. Now, we can move on to installing Cowrie. First, let’s allow traffic on all ports.
IMPORTANT!: Depending on the cloud service you use, you may need to configure the firewall.
Let’s download the required packages for Cowrie.

Let’s create a new Cowrie user that does not require a password.

Let’s switch to the Cowrie user.

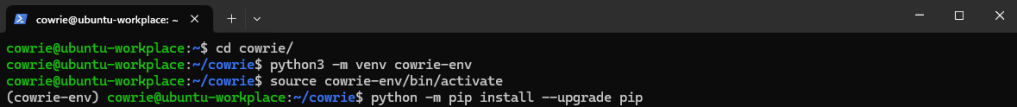
Let’s clone Cowrie from the official Cowrie repository.

Let’s create a virtual environment for Cowrie and update pip.
Let’s install the Cowrie software in editable mode.

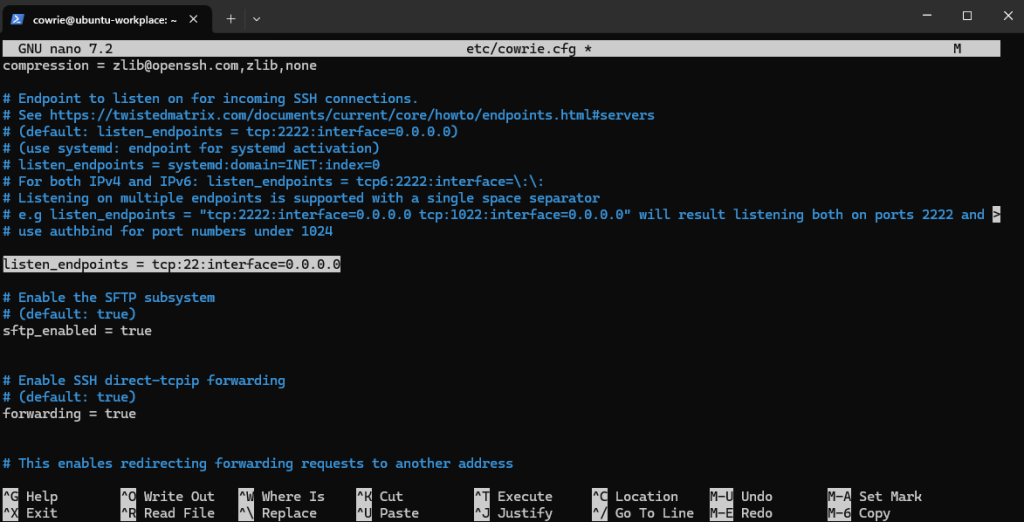
Let’s copy Cowrie’s default configuration template (the .dist file) to create the main configuration file (cowrie.cfg) that we will modify.

Let’s set the port for Cowrie’s fake SSH server. By default, it usually runs on port 2222 (to avoid conflicts with the real SSH service), but we will change it to port 22, because our real SSH service is already running on port 2222.
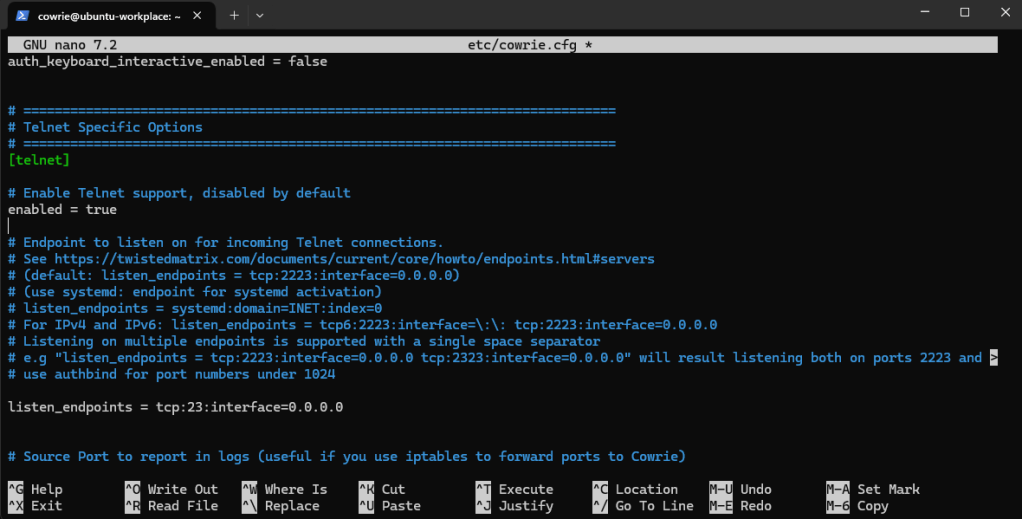
We do the same configuration for the Telnet service as well.
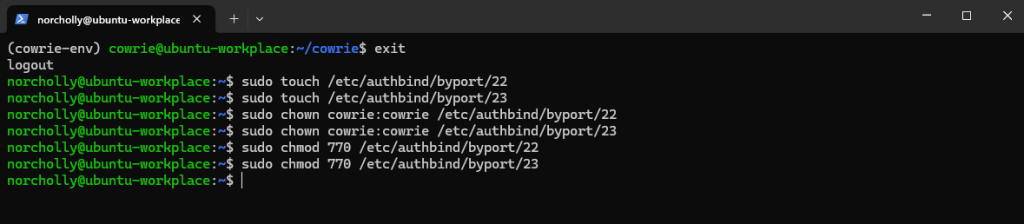
Let’s exit the Cowrie user and switch back to our own user. In Linux, non‑root users cannot use ports below 1024 (like 22 or 23). So, we use authbind to give the Cowrie user permission to use ports 22 and 23 only.
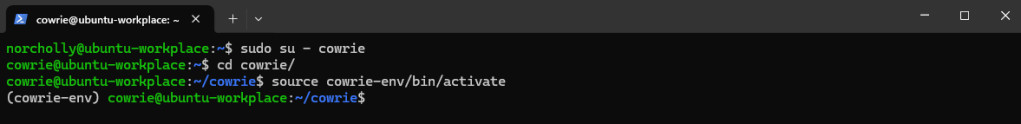
Let’s switch back to the Cowrie user.
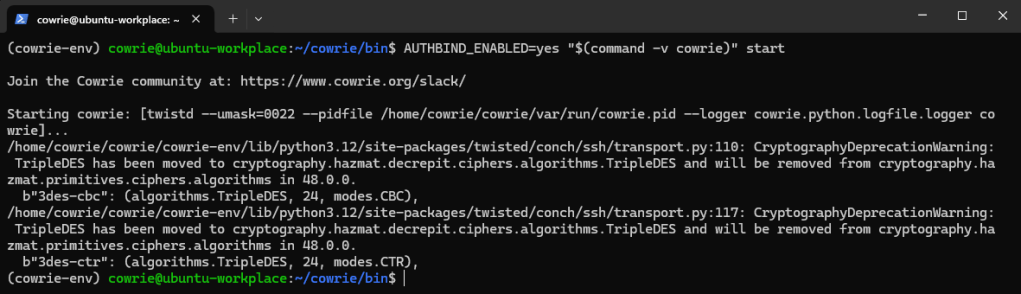
We start Cowrie, telling it to use authbind to open the required ports.
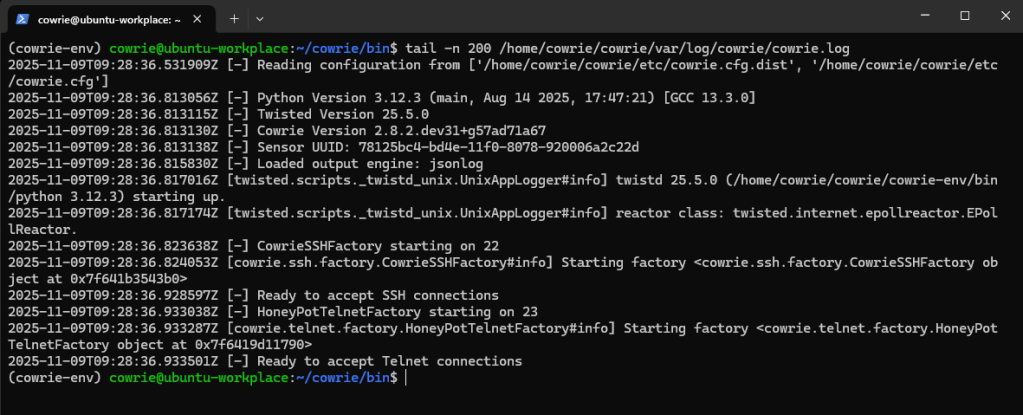
When we check the Cowrie logs, we can see that it has successfully started listening on the ports.
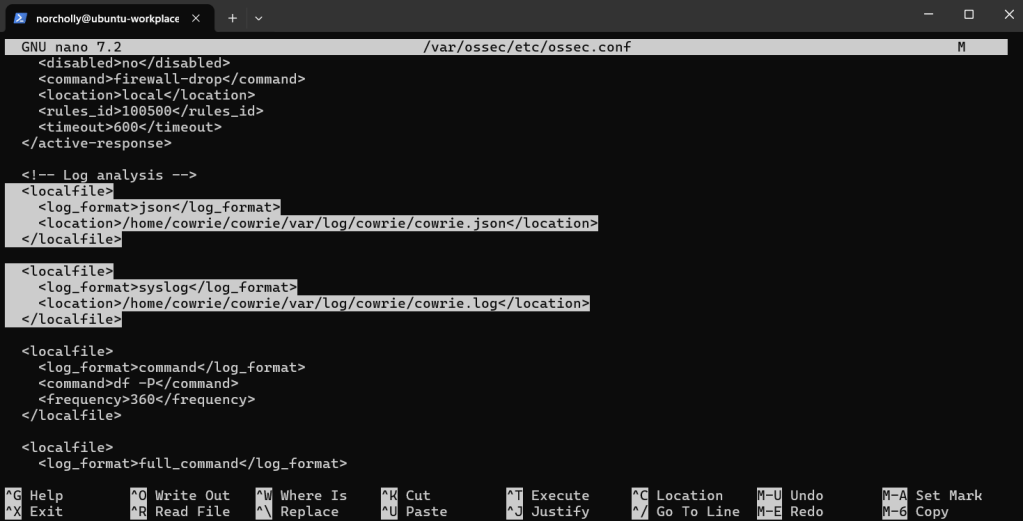
Now, let’s switch to the root user and open the Wazuh configuration file.

Here, we need to edit the configuration file to allow Wazuh to read Cowrie logs.
To apply the changes, let’s restart the wazuh-manager service. (This may take a little time.)

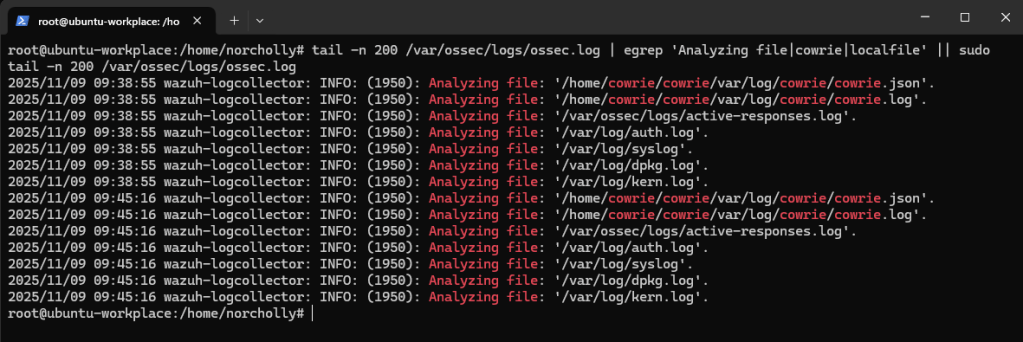
Let’s verify that the Cowrie log file is being processed by Wazuh.
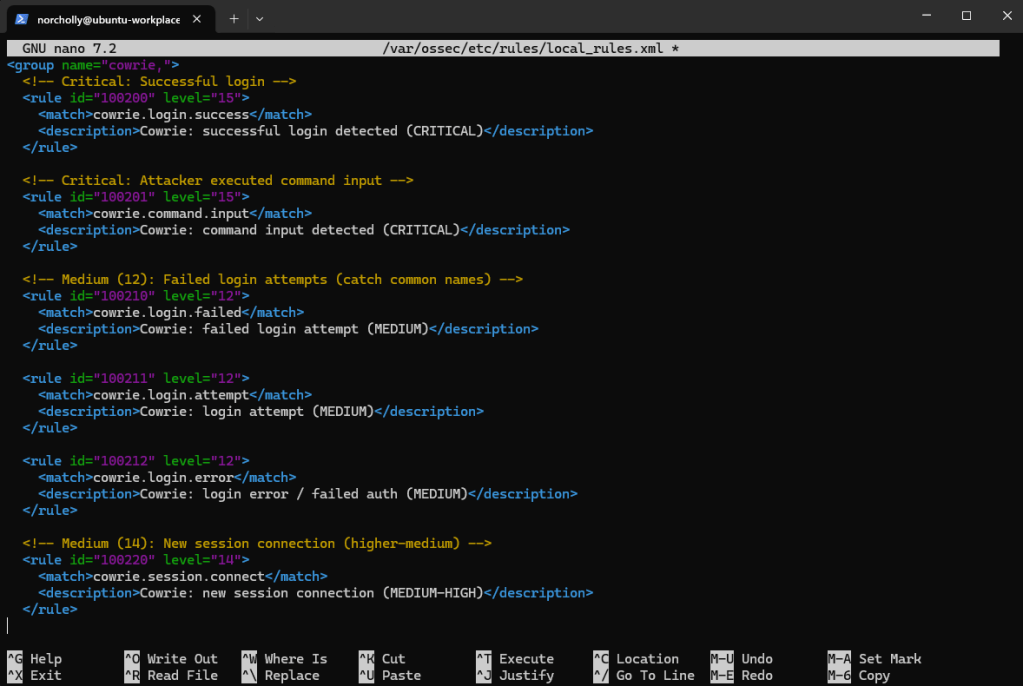
Now, let’s open the rules file to define which alerts will be triggered in different situations and their severity levels.

We created a new group called cowrie. In this group, we wrote rules with critical and medium severity for different events, including successful logins, command usage, failed logins, login attempts, and new session openings.
To apply the changes, let’s restart the wazuh-manager service. (This may take a little time.)

Everything is ready now. The honeypot is running successfully. According to Istanbul time (UTC +3), it’s 13:00. Let’s wait 2 hours and 45 minutes and then check our results.
LOG ANALYSIS AND THREAT INTELLIGENCE
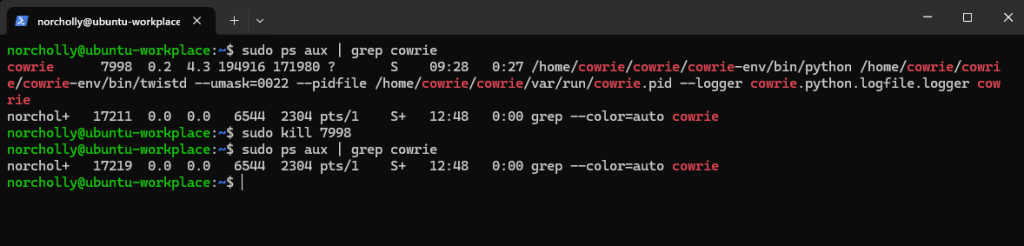
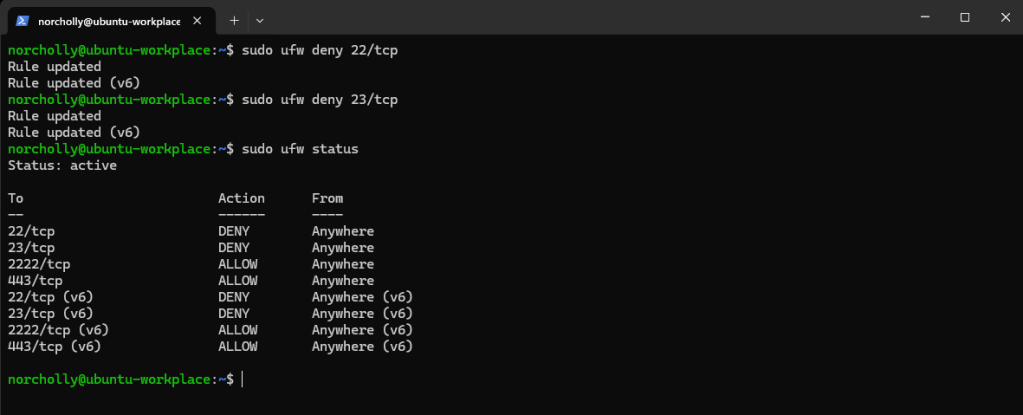
First, let’s stop the Cowrie service so it doesn’t affect our analysis.
And let’s block the traffic coming to ports 22 and 23.
In the Wazuh interface, go to the Discover tab in the left menu and add a filter to view only Cowrie logs.
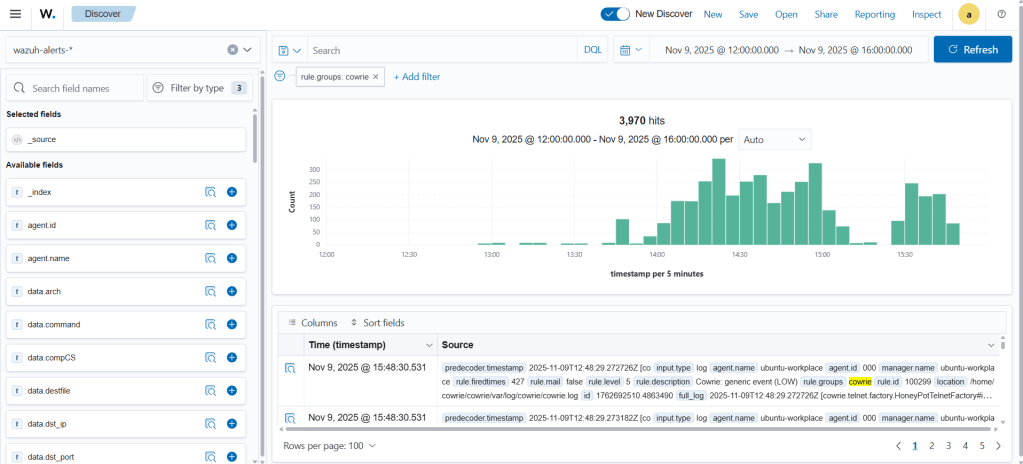
As we can see, there are 3,970 alerts. Now, how many of them are critical? Let’s apply a filter to show alerts with a severity of 15 or higher.
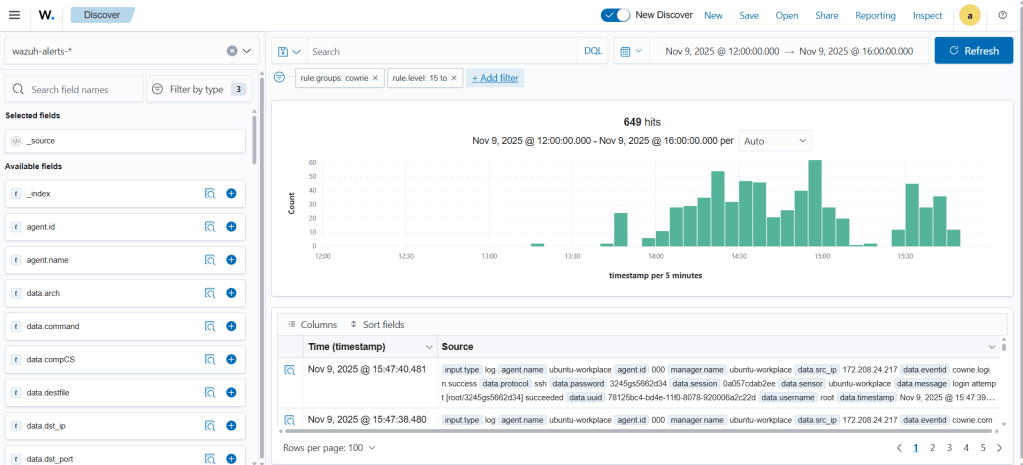
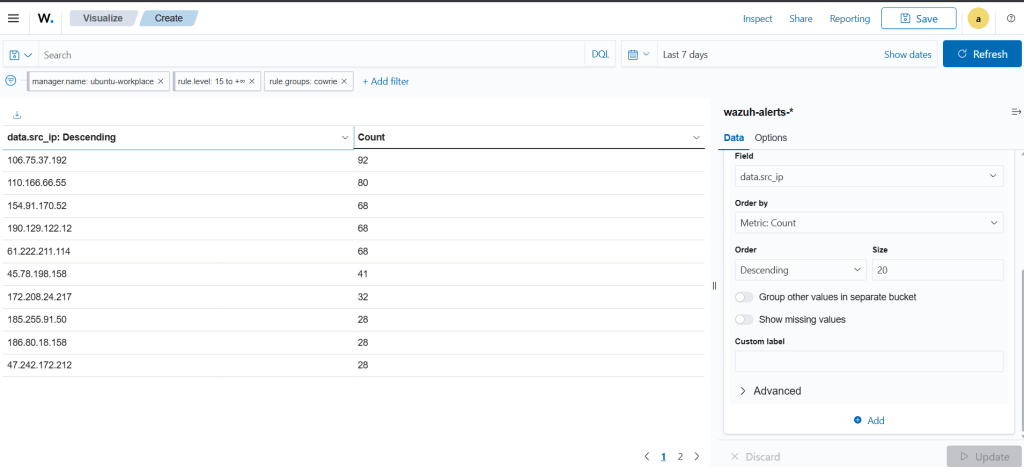
There are 649 critical alerts that arrived within 2 hours and 45 minutes. This is quite a lot. Instead of examining the logs one by one in the Discover screen, a more visual interface is helpful. For this, go to the Visualize tab in the left menu and create a new Data Table. This table shows which IP addresses generated the critical alerts and how many times each appeared.
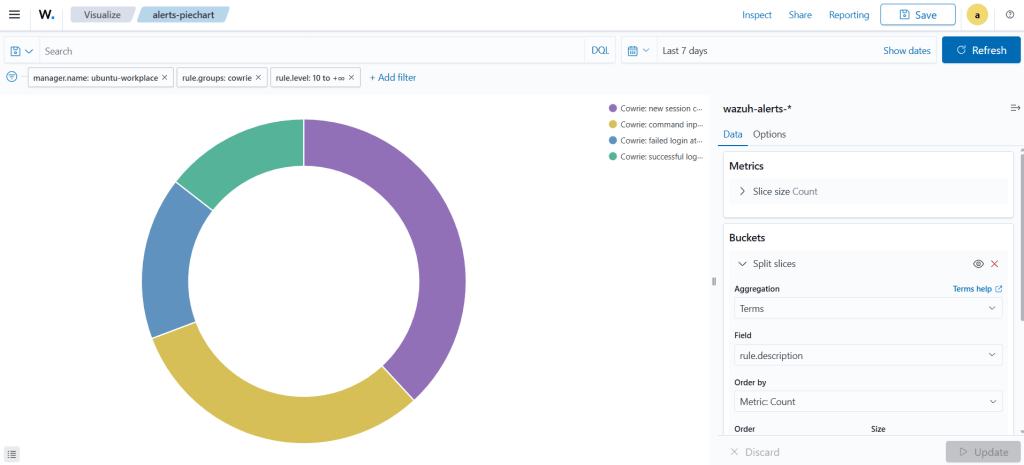
Next, let’s create a pie chart. This pie chart will show which alerts occurred most frequently.
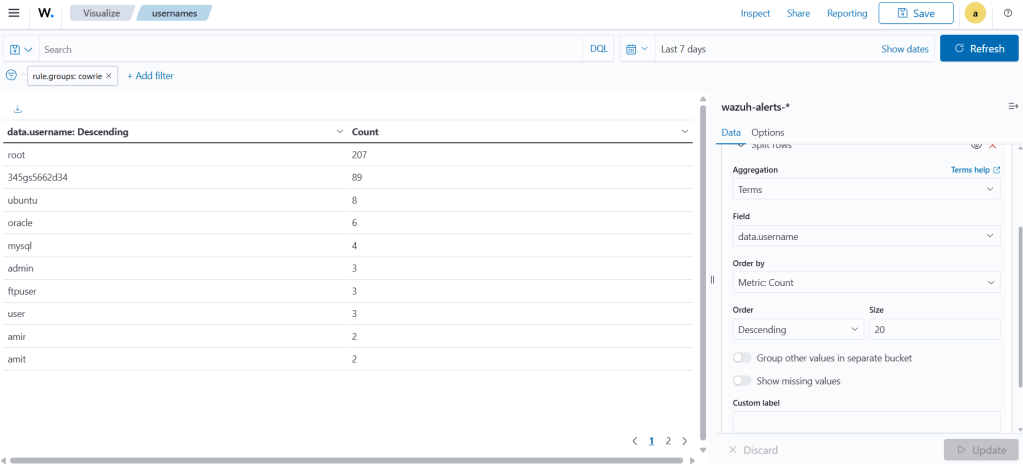
Next, let’s see which username was attempted the most.
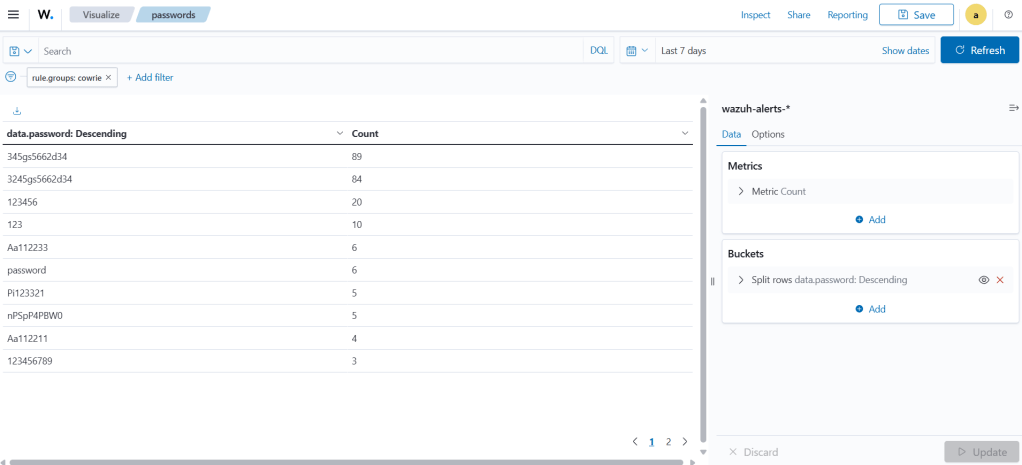
And which password was tried the most.
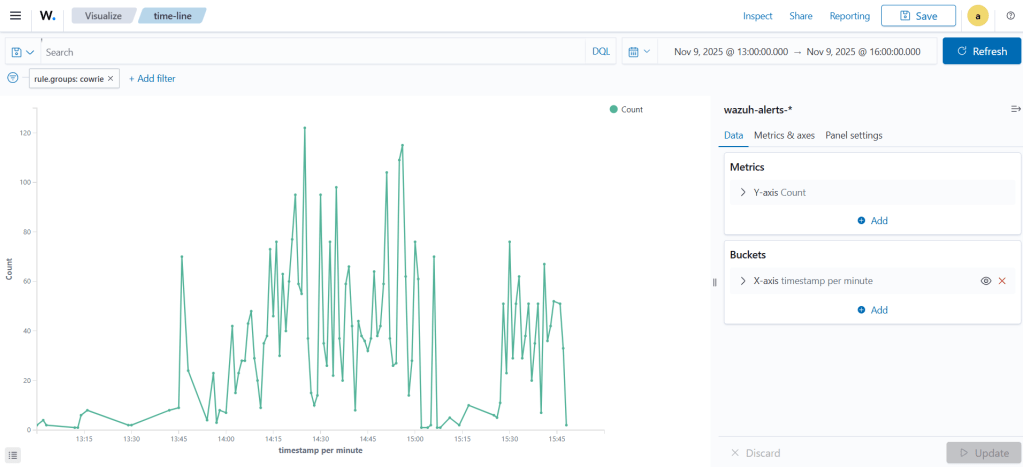
When did the alerts occur most frequently during this period?
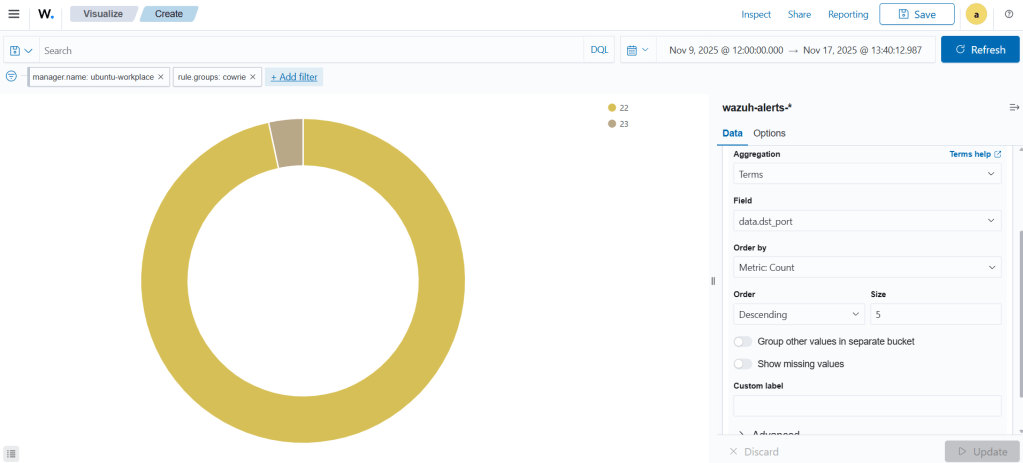
If you remember, we opened two ports: 22 and 23. So, which service received the most attacks: SSH or Telnet?
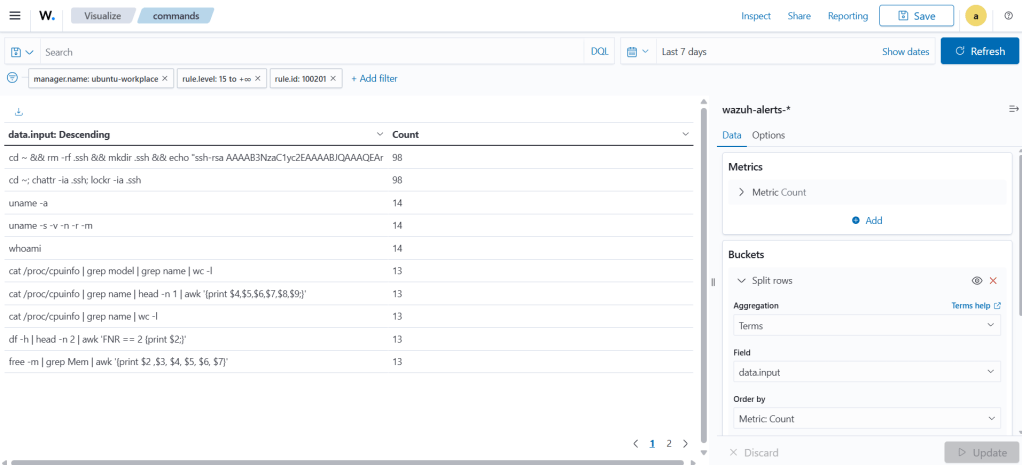
For the attackers who successfully logged into Cowrie — our honeypot — which commands did they run, and how many times were they executed?
This is enough visualization for now. If we want to see all these visuals on a single screen, we need to create a new dashboard and add them there.
When we start analyzing our logs through the dashboard, we can see the following numbers: 542 new sessions, 206 successful logins, 231 failed logins, and a total of 443 command inputs.
The first of the two most frequently used commands (used 98 times) is:
cd ~ && rm -rf .ssh && mkdir .ssh && echo "ssh-rsa AAAAB3NzaC1yc2EAAAABJQAAAQEArDp4cun2lhr4KUhBGE7VvAcwdli2a8dbnrTOrbMz1+5O73fcBOx8NVbUT0bUanUV9tJ2/9p7+vD0EpZ3Tz/+0kX34uAx1RV/75GVOmNx+9EuWOnvNoaJe0QXxziIg9eLBHpgLMuakb5+BgTFB+rKJAw9u9FSTDengvS8hX1kNFS4Mjux0hJOK8rvcEmPecjdySYMb66nylAKGwCEE6WEQHmd1mUPgHwGQ0hWCwsQk13yCGPK5w6hYp5zYkFnvlC8hGmd4Ww+u97k6pfTGTUbJk14ujvcD9iUKQTTWYYjIIu5PmUux5bsZ0R4WFwdIe6+i6rBLAsPKgAySVKPRK+oRw== mdrfckr">>.ssh/authorized_keys && chmod -R go= ~/.ssh && cd ~
This command completely removes a user’s SSH configuration and replaces it with a new SSH public key. By doing this, the attacker creates a persistent backdoor, allowing them to reconnect to the system at any time using their own key.
The second command is:
cd ~; chattr -ia .ssh; lockr -ia .ssh
This command adjusts the necessary permissions so the first command can run successfully. The remaining commands—which were used far less—are mostly reconnaissance commands designed to gather information about the system.
When we check the most frequently used IP addresses on VirusTotal, we can see that they are marked as malicious.
Looking at the time graph, we observe a linear rise and fall in activity. Between 15:10 and 15:30, there is a noticeable drop in alerts.
As expected, the most frequently attempted username is root. The most frequently used password is 345gs5662d34. This password is well‑known globally among honeypot operators and is considered a common botnet signature.
The most likely reason for its popularity is that it is probably the default factory password for a specific IoT device, DVR, or router produced in China or Taiwan. Interestingly, according to security researchers (such as the SANS Internet Storm Center), the string 345gs5662d34 is often attempted both as the username and the password.
Finally, when we look at the pie chart showing which port received more attacks, we see that 529 alerts (97.24%) targeted port 22, while 23 alerts (2.76%) targeted port 23.
SUMMARY
High Attack Volume: In just 2 hours and 45 minutes, there were 649 critical alerts out of almost 4,000 total alerts. This shows attackers constantly probe exposed ports.
Targeted Ports: Most attacks (97%) targeted SSH (port 22) rather than Telnet (port 23). This matches common attacker behavior, since SSH is more likely to be exploited for remote access.
Common Credentials: The most tried username was root, and the most used password was 345gs5662d34. This is a well-known default password for certain IoT devices and is widely used by botnets.
Attacker Behavior: Successful logins executed commands to install a persistent backdoor via SSH keys, and also modified permissions to enable these actions. Other commands mostly gathered system information.
Malicious IPs: The IP addresses generating these alerts are malicious, according to VirusTotal, confirming these are real threats rather than false positives.
Attack Timing: The attack pattern shows a roughly linear increase and decrease, with some fluctuations (like the drop between 15:10 and 15:30).

Yorum bırakın